DP-600 Fabric Analytics Engineer Associate Certification
The new Fabric Analytics Engineer Associate Certification was announced in November 2023 and now it has finally come out of the Beta
The new Fabric Analytics Engineer Associate Certification was announced in November 2023 and now it has finally come out of the Beta
“A day without a challenge, is a day without a learning!” Today, I got a requirement from a client, where they asked
Current month Power BI update has got so many additions to it from having new card visual to Power BI Developer Mode;

Hello Everyone, Some new data this time, some new trends and some new insights. This time I have taken data related to
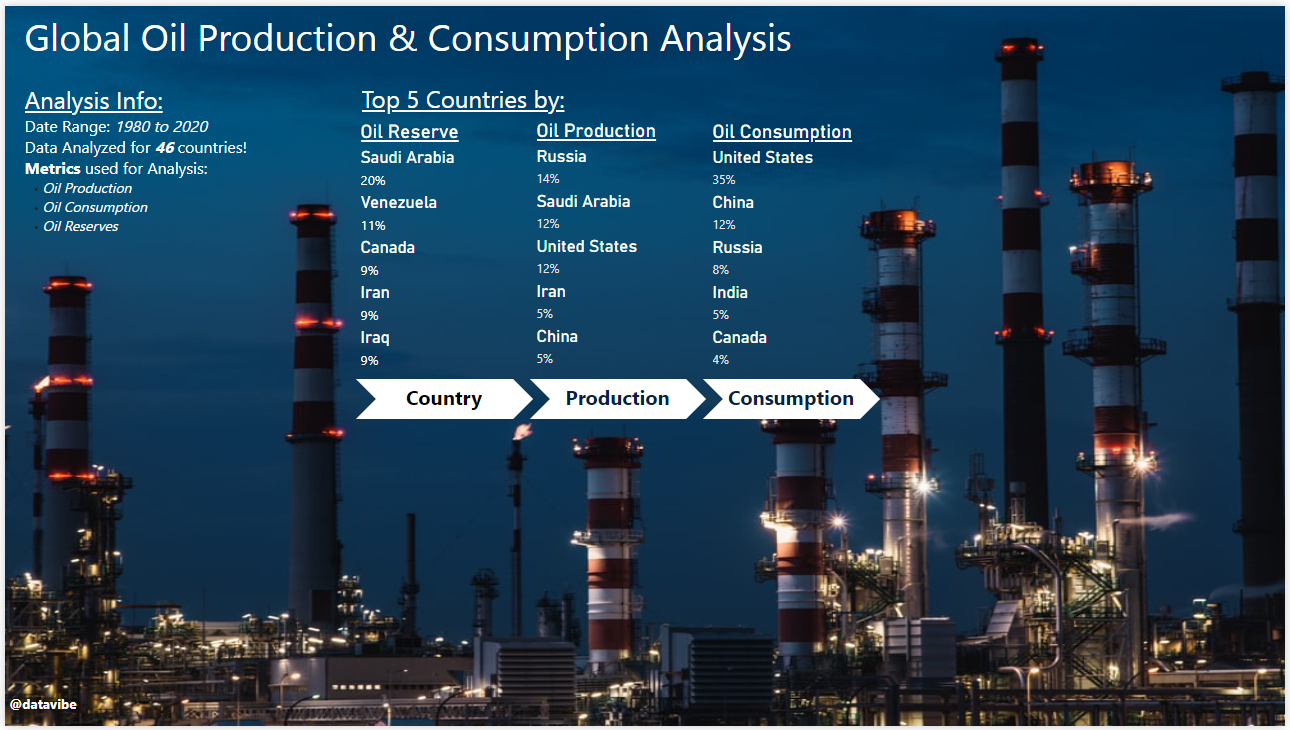
Hello Everyone, This month’s data story shows some new trends and insights.This month I have taken data related to the Global Oil Reserves,
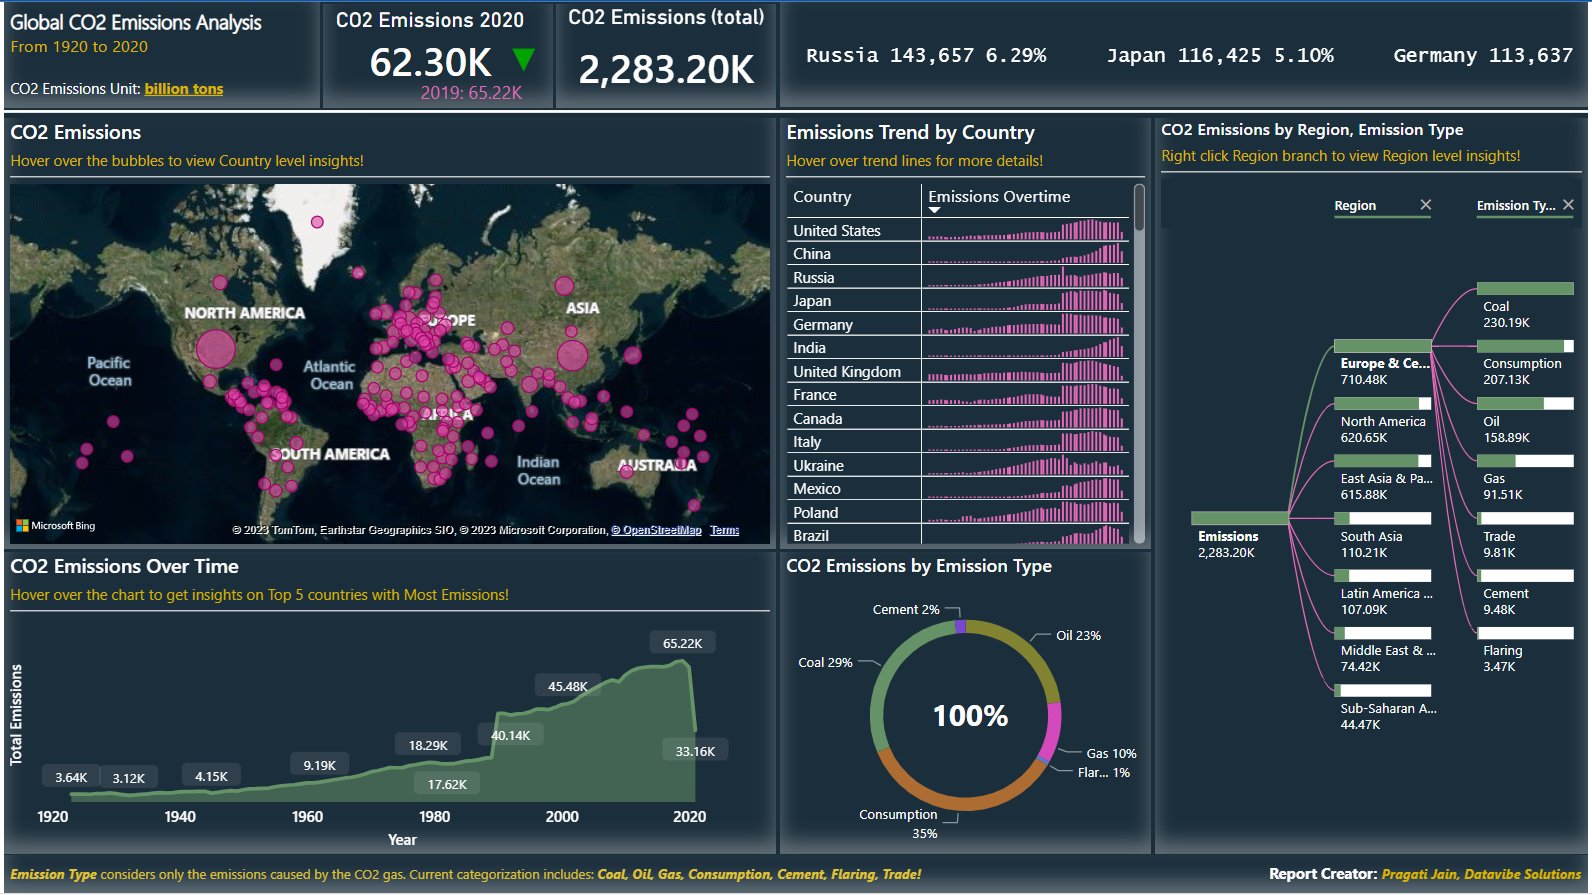
Hello Everyone, This is my first post to storytelling on my blog. I will posting more data stories soon. CO2 emissions globally
Ever thought of displaying dynamic date formats using a slicer in a Power BI dashboard? Today in this blog I will be
Today in this blog we will talk about scheduling the data exports from Power BI. I have recently come across a requirement
In the last couple of days, many of my connections on LinkedIn have approached me for good Power BI resources that can
Let us consider a scenario where we need to represent similar information at two different category levels. One potential and easiest way