
Another day and another opportunity to learn something new!
If you have been following my blogs on the Microsoft Fabric, then this blog is the 4th in the series of blogs I plan to write in the coming months on Microsoft Fabric. If Fabric is still a new term to you, you can go back and check my following blogs on it to get a better understanding about Fabric and how to get started:
- Microsoft Fabric – SaaSified Analytics Solution
- Microsoft Fabric – Getting Started
- Getting On-Premises SQL Server Data to Fabric Lakehouse
In this blog we will be exploring the next steps on after we get data into Fabric Lakehouse from the on-premise SQL Server Database. As mentioned in the previous blog here on Getting On-Premises SQL Server Data to Fabric Lakehouse, I have got all the relevant tables in my Lakehouse.
Data Preview
Navigating to SQL End point created for my Lakehouse; under Data pane, I can see all the tables that I have ingested from the on-premise SQL Server database.
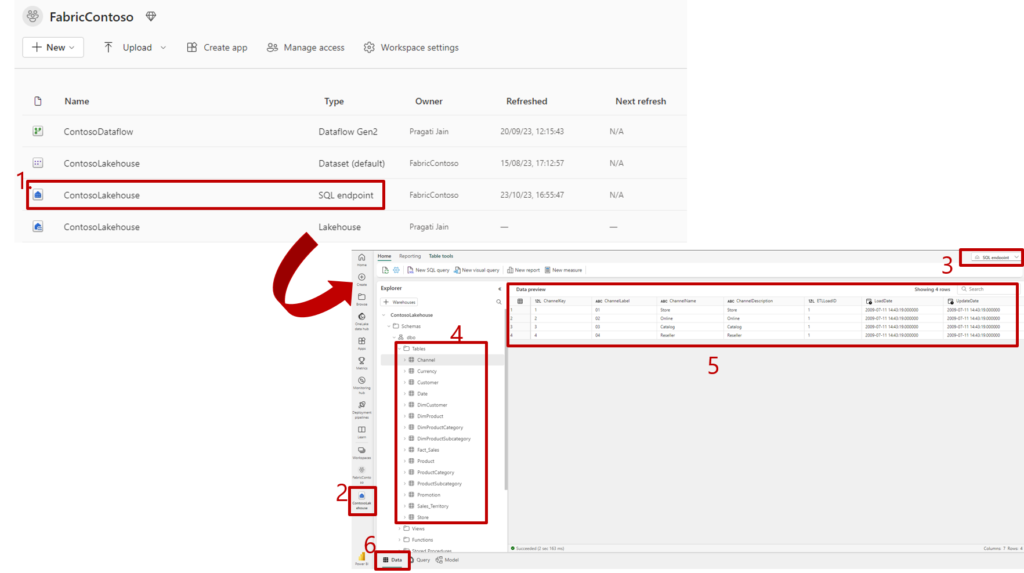
- ContosoLakehouse – SQL endpoint in the Fabric Workspace
- SQL endpoint – endpoint selected that is created in the Fabric Workspace
- SQL endpoint option – confirm that the right artifact is selected in the Fabric workspace
- Tables – List of tables ingested from SQL Server on-premise
- Data Preview – preview of data for the first table under tables list
- Data View – shows that we are under data view and seeing it’s preview
You can easily navigate to all the ingested tables and make sure the right data is loaded.
Model View – Creating the Data Model
Let’s now toggle to the Model view from the bottom left of the above window.

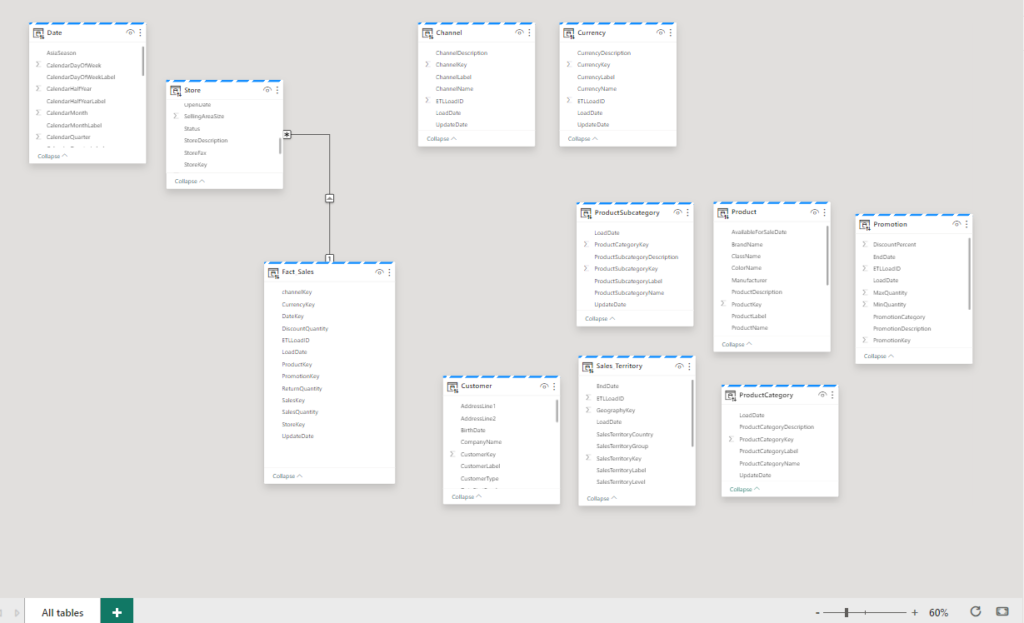
Once the Model view is selected, you will see the following window with all of your ingested tables.
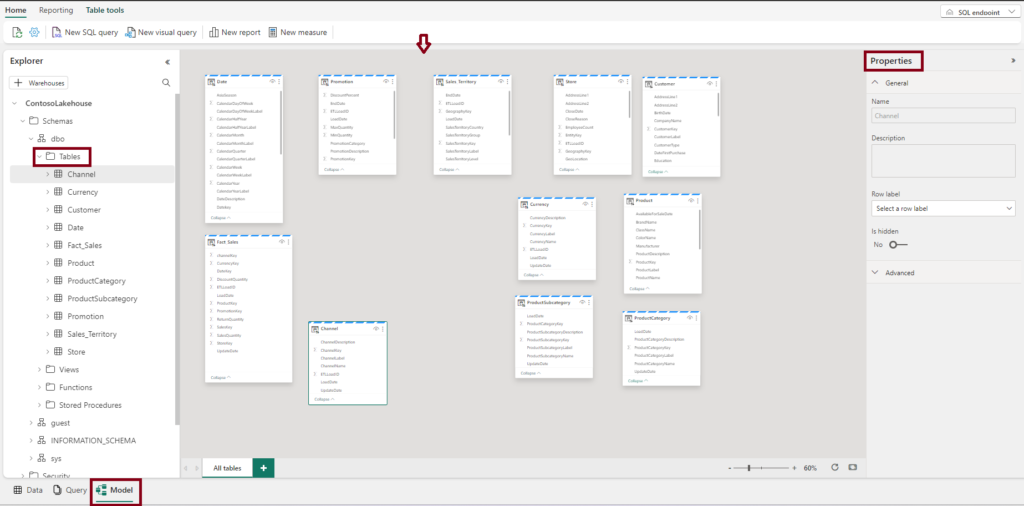
Under Model view, we see the following:
- List of tables on the left
- Model canvas for creating a data model using all the ingested tables
- Properties pane for modelling view like we have in Power BI Desktop app
Now I can start creating my data model. Let us first create relationship between Store table and Fact Sales table on Store Key column. The moment I drag Store Key column from Store table to Fact Sales table, a new window appears as shown below.
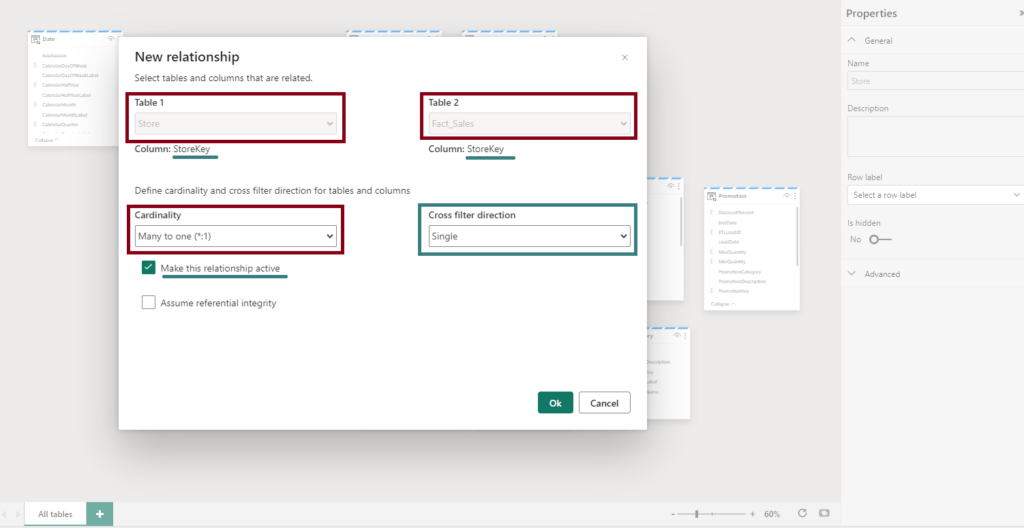
This has already got the details like:
- Table names on which we are trying to create a relationship
- Column name on which relationship is detected
- Cardinality of relationship
- Cross filter direction for filtering the data
Once I hit ok, I can see the relationship is created.
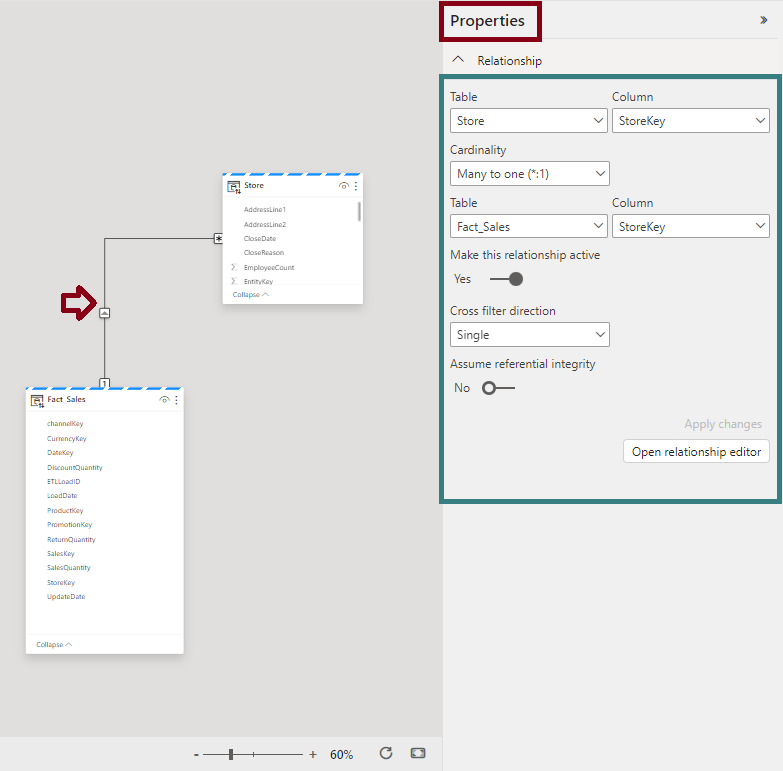
Properties Pane – Relationship
If you have worked on the Power BI Desktop, you will see similarity on this pane with all the similar options. Once I click on the relationship between Store table and Fact Sales table, I can see all the relevant relationship information.
- Table 1 with the key column on which relationship is (Store –> StoreKey)
- Table 2 with the key column on which relationship is (Fact_Sales –> StoreKey)
- As the relationship is active (inactive is represented by dotted/broken line), Make this relationship active is Yes
- Cross filter direction is Single
Properties Pane – Table
If I say just select Fact Sales table, I end up seeing general details about the table under the Properties pane.
- Name of the table
- Description if you have any
- Row label is you have set-up any
- Is hidden – in this case No as table is not hidden
- Storage Mode – in this case DirectLake
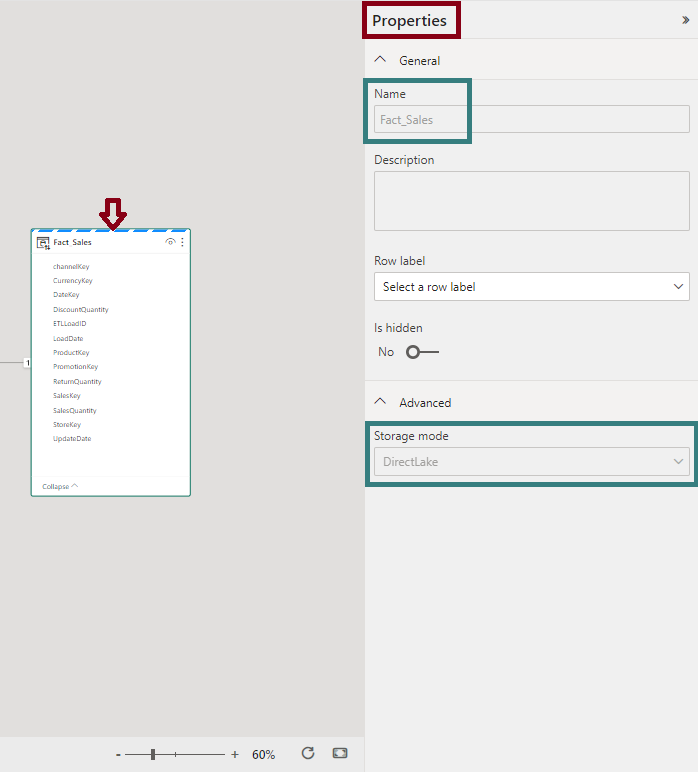
The main thing to note here is the Storage Mode = DirectLake. We will talk about this in detail in a separate blog. But for now you can consider this as the new storage mode for connecting data within Power BI.
We can call it as fusion of both DirectQuery and Import storage modes that is supposed to deliver the performance given by the Import mode PLUS the real-time power of the DirectQuery mode.
DirectLake = DirectQuery + Import
Data Model
Once I create all the relevant relationships among the Fact and Dimension tables, I end up with the following:
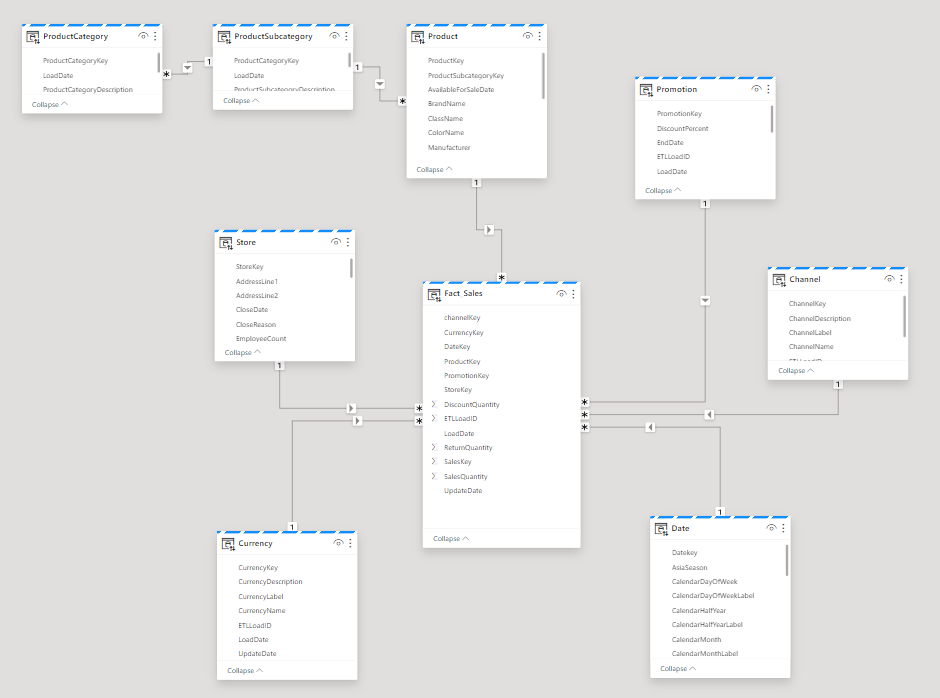
We have finally created a our first complete data model within Fabric environment. In the next blog we will look at adding calculations like measures on top of this model.
Hope this blog gave you enough idea around how we can easily get our data model ready in the web view. So far we haven’t used Power BI Desktop app. We are building things directly in cloud or Power BI Service. Let’s explore more in the upcoming blogs.
Happy Fabric Learning!
Pragati
A perfect collection of tips and strategies! greatly beneficial blog! Thank very much for this great piece.
Very helpful tips. Thanks for this.