
I just stepped off the stage at SQLSaturday Atlanta and the energy around Microsoft Fabric is absolutely electric. Between the deep-dive sessions and the hallway conversations, one question kept coming up: “How do we make our data orchestration more efficient?”
In the world of Synapse and Data Factory, we’ve been conditioned to “Poll.” We set a schedule to check a table every 15 minutes, 24/7. But in a Capacity-based world like Fabric, “Polling” is essentially a tax on your resources.
Today, I’m sharing the framework I demoed in Atlanta – moving from expensive “Ghost Pipelines” to a lean, event-driven architecture that only works when there is a “doorbell” to answer.
1. The Problem: The “Ghost” Pipeline
A “Ghost Pipeline” is a scheduled process that wakes up, starts a Spark cluster, finds no new data and shuts down. It wastes Capacity Units (CUs) and clutters your logs.
The Vision: We want our pipeline to sleep until the exact millisecond a record in our SQL Database is marked as ‘Ready’.
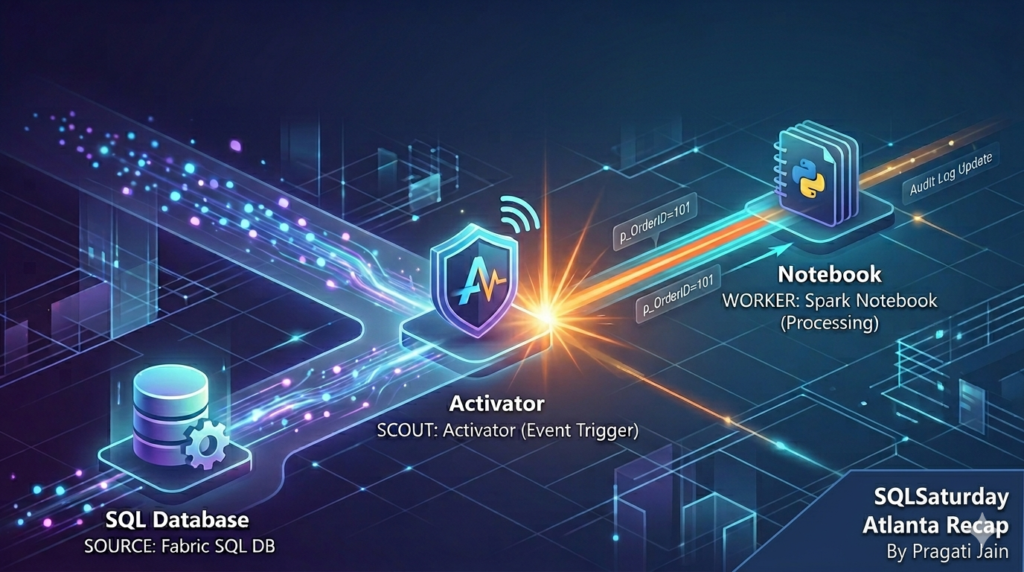
2. The Architecture: The Four-Way Handshake
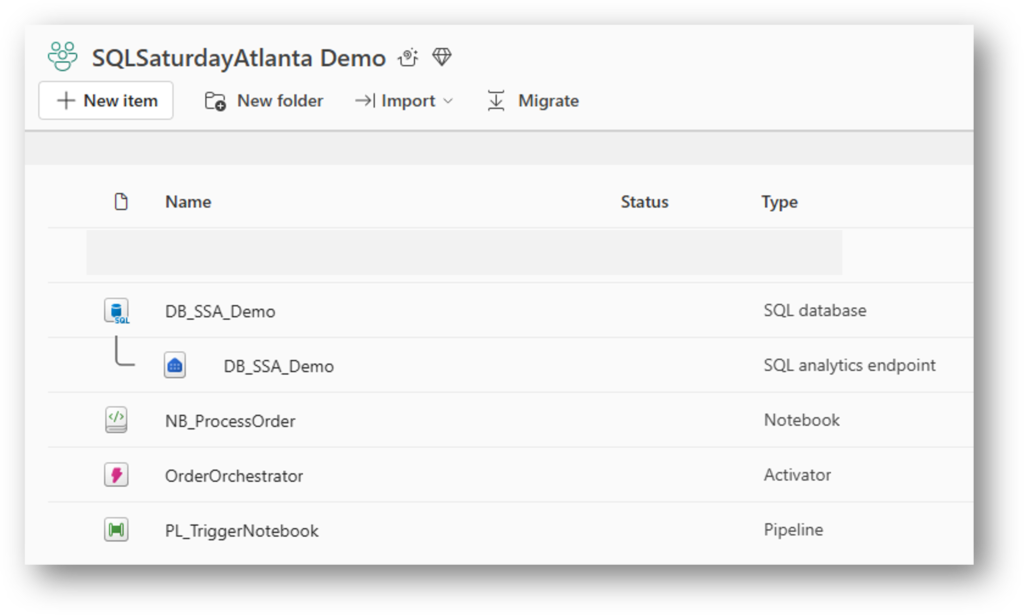
To achieve this, we synchronize four Fabric components:
- SQL Database: The source of truth.
- Activator: The “Scout” watching OneLake for file changes.
- Data Factory Pipeline: The “Bridge” carrying the
OrderIDparameter. - Spark Notebook: The “Worker” processing only that specific ID.
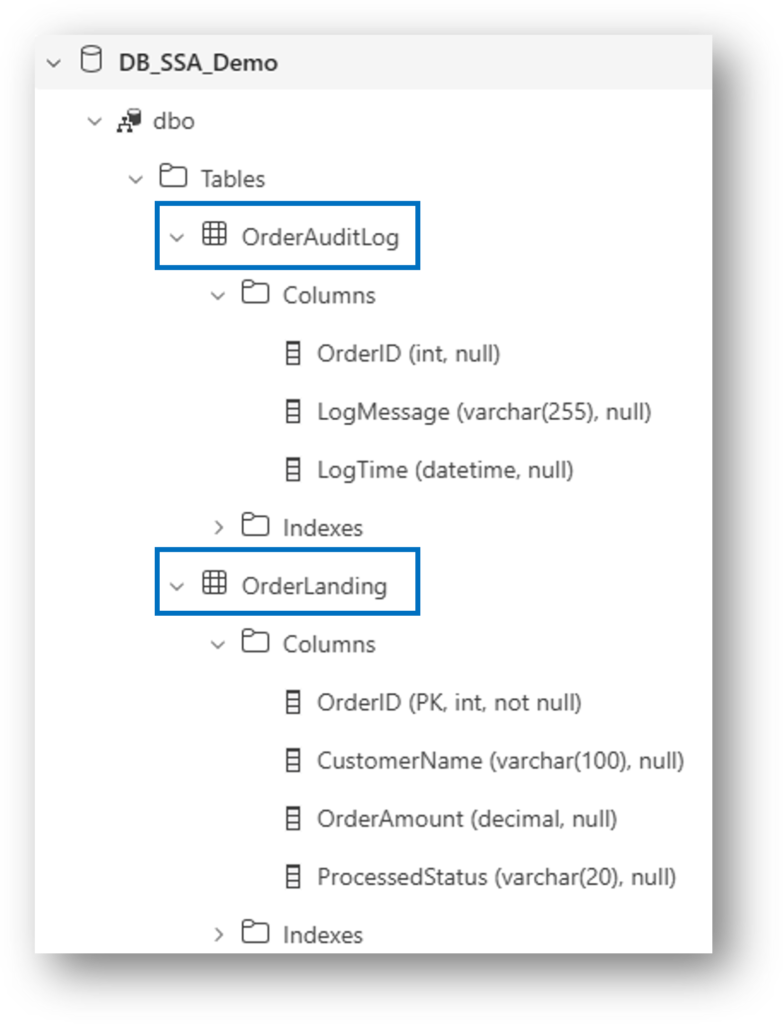
3. The Foundation: SQL Database Schema
Before we can react to data, we need a structure that supports state-tracking. We use two tables: a Landing Table (where the data arrives) and an Audit Log (to prove our work).
The key here is the ProcessedStatus column. This is our “traffic light”- it tells the Activator when to trigger and tells the Notebook when to stop.
The Schema
-- The Source: Where the "Doorbell" lives
CREATE TABLE dbo.OrderLanding (
    OrderID INT PRIMARY KEY,
    CustomerName VARCHAR(100),
    OrderAmount DECIMAL(10,2),
    ProcessedStatus VARCHAR(20) DEFAULT 'Pending' -- 'Pending', 'Ready', 'Completed'
);

-- The Proof: Our Audit Trail
CREATE TABLE dbo.OrderAuditLog (
    AuditID INT IDENTITY(1,1) PRIMARY KEY,
    OrderID INT,
    ProcessedTime DATETIME DEFAULT GETDATE(),
    LogMessage VARCHAR(255)
);
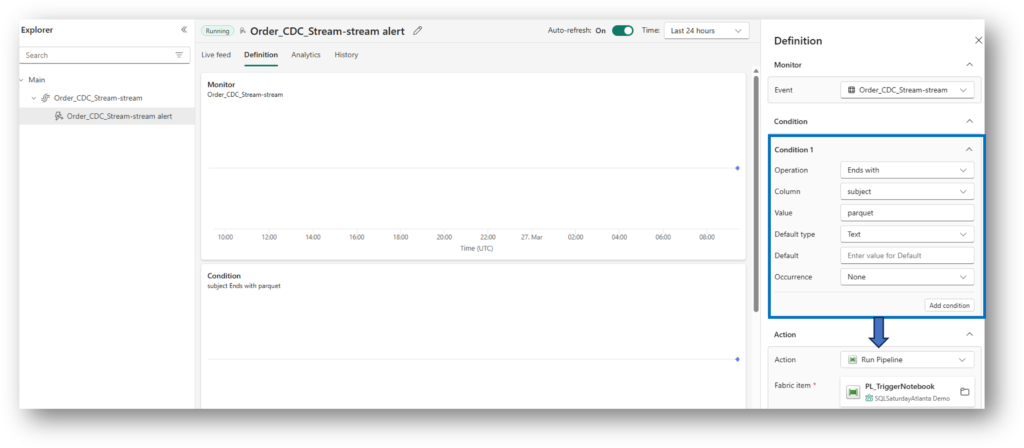
3. The Trigger: Fabric Activator
Fabric SQL Database writes Parquet files to OneLake. We set an Activator to watch the OrderLanding folder. When a file arrives where ProcessedStatus = 'Ready', the “doorbell” rings. Basically, Activator captures all the “parquet” file type events that land in this folder. Once the condition is met, Pipeline is triggered which further executes a Notebook.
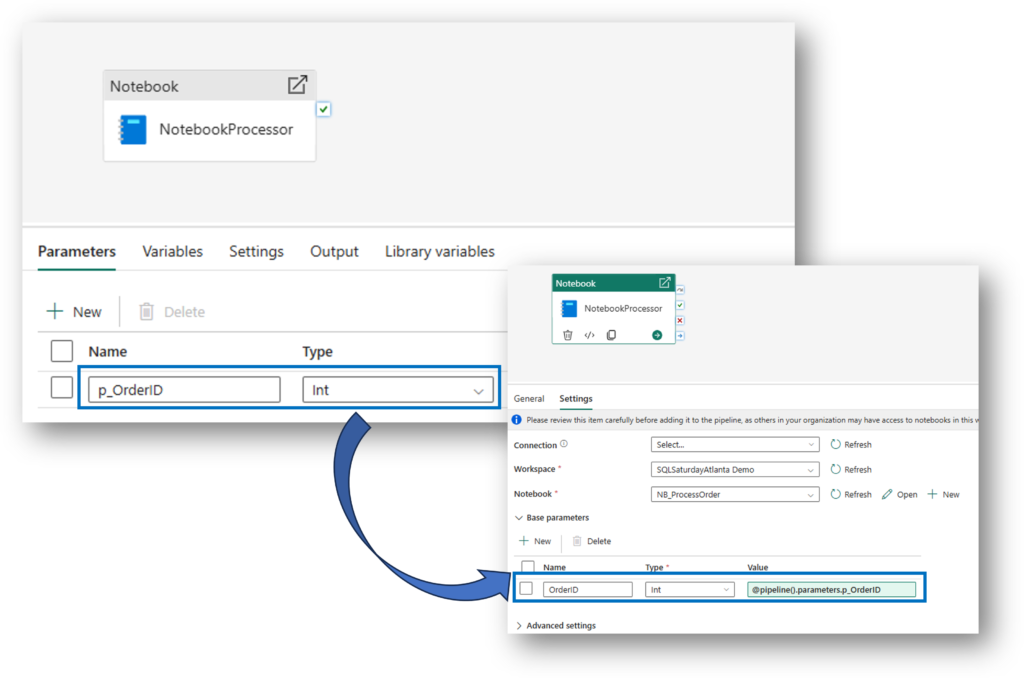
4. The Bridge: Parameterized Pipelines
The secret to efficiency is telling the Notebook exactly which row to process. We pass the OrderID from the Activator to a Pipeline Parameter.
5. The “Bulletproof” Logic: Idempotency Guard
During my Atlanta session, we addressed a key quirk: Fabric might trigger a pipeline twice for one update. To prevent duplicate processing, we add an Idempotency Guard in the Spark Notebook.
Before doing any work, the notebook checks: “Is this already ‘Completed’?” If yes, it exits safely.
# THE GUARDRAIL
current_status = check_df.collect()[0]['ProcessedStatus']

if current_status == 'Completed':
    print(f"⚠️ Order {p_OrderID} is already 'Completed'. Exiting safely.")
    mssparkutils.notebook.exit("Duplicate Trigger Ignored")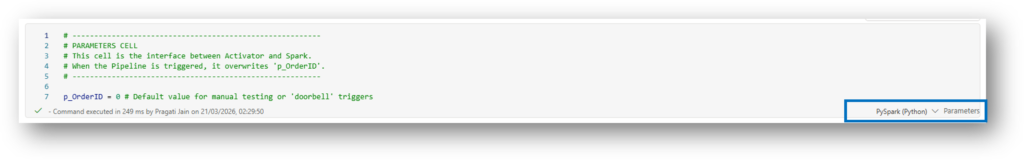
6. Ensuring Persistence: JDBC Auto-Commit
To ensure the database saves the change immediately (so the second “ghost” run sees the ‘Completed’ status), we use Java JDBC properties to force an auto-commit.
# Ensure immediate persistence in Fabric SQL
db_gate = sc._gateway.jvm.java.sql.DriverManager
props = sc._gateway.jvm.java.util.Properties()
props.setProperty("accessToken", token)

conn = db_gate.getConnection(jdbc_url, props)
conn.setAutoCommit(True)

stmt = conn.createStatement()
stmt.execute(f"UPDATE dbo.OrderLanding SET ProcessedStatus = 'Completed' WHERE OrderID = {p_OrderID}")
conn.close()
7. The Proof: Monitoring the Success
When you check the Monitoring Hub, you will notice something curious: The Pipeline triggered twice, even though we only updated a single row. Why the Double Trigger? This isn’t a bug; it’s a side effect of how Fabric SQL Database is architected on top of OneLake.
- The Data Write: When you run an
UPDATE, Fabric writes a new Parquet file to OneLake. - The Log Write: Almost simultaneously, it updates the Delta Log (json) to track that change.
Because Activator is “watching” the folder in OneLake, it sees multiple file-system events for what looks like a single logical database transaction.
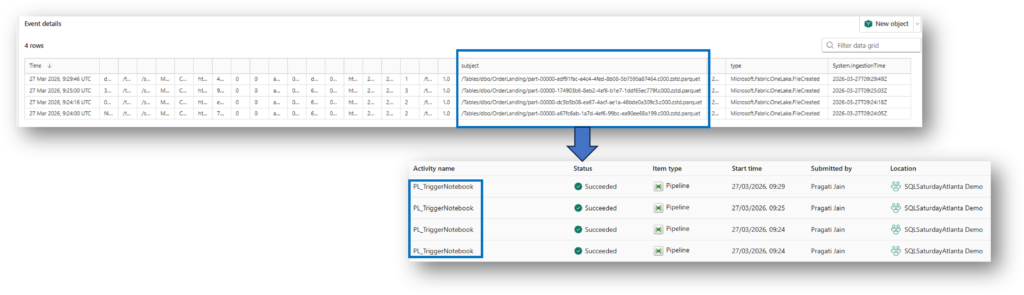
Here we can see that the last pipeline took the most time when compared to 3 pipeline triggers that initiated before this final pipeline. This makes us think is this “wrong” because in reality the first pipeline trigger should pick up the record to be processed but here it seems it’s the last pipeline trigger.
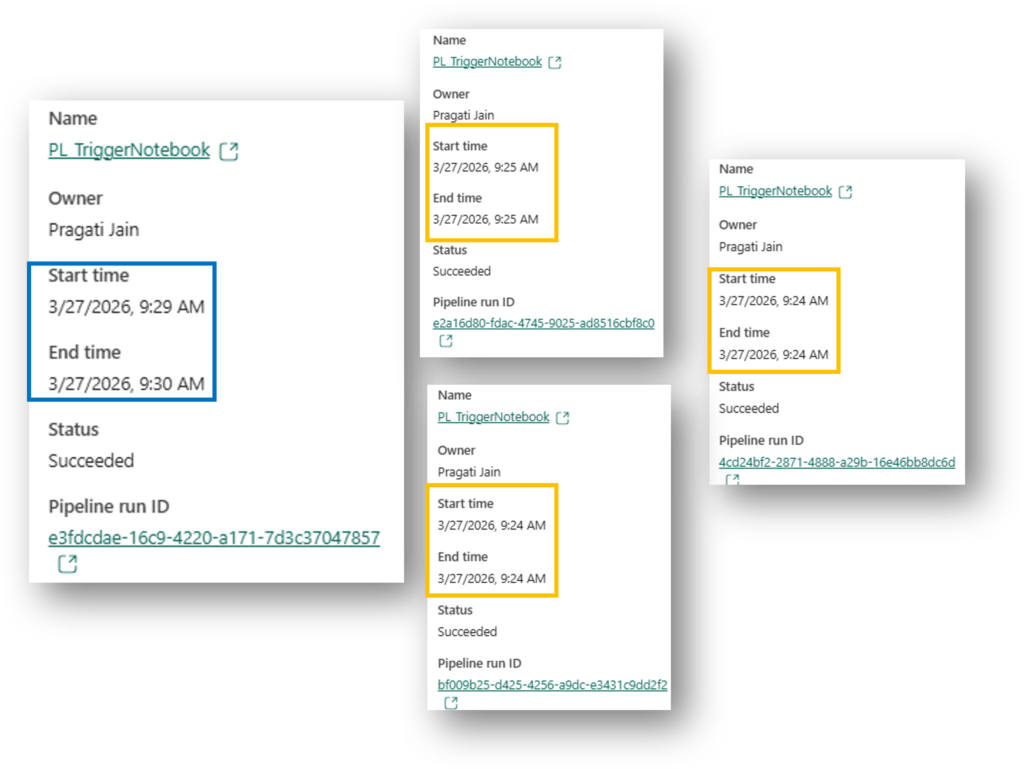
Simple answer to this is – It’s not “wrong,” but it reveals exactly how Distributed Systems (like Fabric) work under the hood. Here is the technical explanation for why your 4th run was the winner, while the first three “failed” or exited quickly.
The Explanation: The “Race Condition” & Spark Cold Starts
In a perfect world, the first trigger wins. But in a real-world cloud environment, several things happen simultaneously:
- The Spark “Cold Start”: When the first three pipelines triggered, they likely tried to start a Spark session. If the session wasn’t fully “warm” or if there was a slight delay in the metadata sync between the SQL Database and OneLake, those first notebooks might have queried the table and seen “Pending” or “Old Data” before the file was fully committed.
- The “Write-Behind” Lag: Fabric SQL Database is “Log-First.” The data hits the log, but the Parquet file in OneLake (which Activator is watching) might take a microsecond longer to be “visible” to the Spark engine.
- The Winner: The 4th Pipeline likely started just a few seconds later, once the Spark session was fully active and the SQL metadata had perfectly synchronized. It grabbed the record, locked it, and moved it to “Completed.”
“Don’t be alarmed if you see multiple triggers in the Monitoring Hub. As long as your Notebook is Idempotent (checks the status before acting), the first run to successfully ‘claim’ the record will do the work, and the rest will exit safely. This is the beauty of distributed cloud architecture!”
“This behavior actually proves why our architecture is superior to a simple schedule. If we had used a schedule and it missed the data, we’d wait 15 minutes. With Activator, the system ‘retried’ itself instantly until the job was done.”
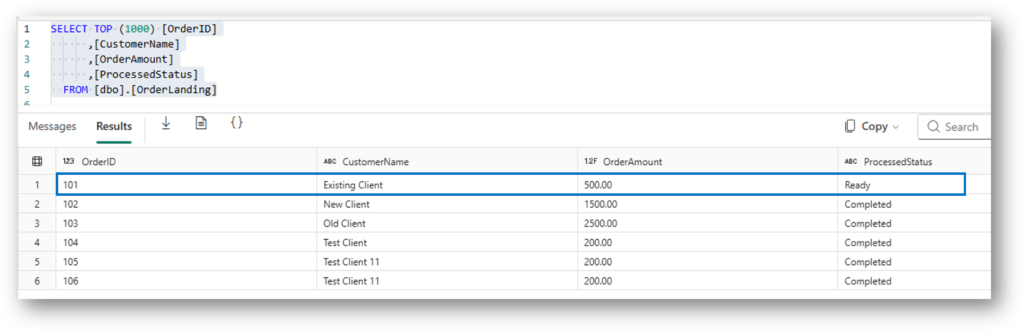
8. The Result: Final SQL Database State
After the dust settles and the Spark Notebook finishes its work, we return to the SQL Database to see the outcome. This is the “Verification” step that proves our event-driven handshake was successful.
We are looking for two specific things:
- Status Update: The
OrderLandingtable should now showCompletedfor the Order ID we processed. - Audit Trail: The
OrderAuditLogshould have a new entry, providing a permanent record of when the Spark engine finished the job.
-- Check the updated status
SELECT * FROM dbo.OrderLanding WHERE OrderID = 101;

-- Check the audit log for the timestamp
SELECT * FROM dbo.OrderAuditLog ORDER BY ProcessedTime DESC;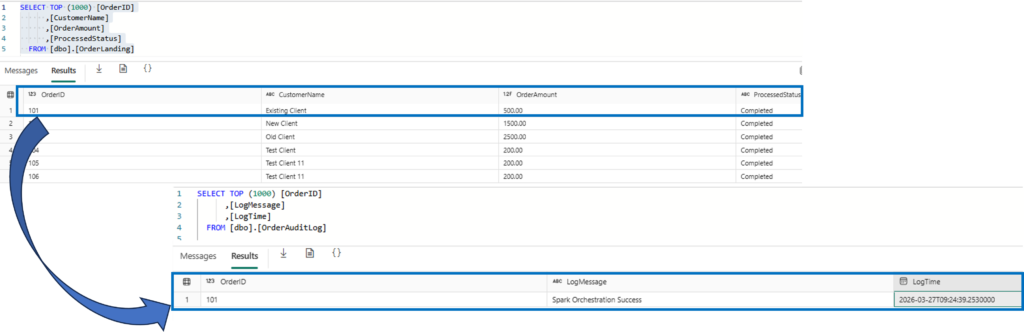
Summary: From Polling to Reacting
In the end, we proved that we don’t need to spend our Fabric Capacity on “Ghost Pipelines.”
By using Activator as our scout and Spark as our targeted worker, we built a system that is:
- Intelligent: It only runs when data is ready.
- Resilient: It handles multiple triggers (even the 4-trigger “race condition” we saw!) without breaking.
- Transparent: Every step is logged back to our SQL Audit table for full visibility.
Final Thoughts
The move from “Schedules” to “Events” is a massive win for both performance and cost-optimization. Thank you to everyone at SQLSaturday Atlanta for making this session so engaging!
Are you ready to stop polling and start reacting? Let me know your thoughts in the comments!